- Accueil
- Qui nous sommes
- Nos projets
- Investisseurs
- Aperçu
- Informations sur les actions
- Présentations
- Événements et webdiffusions
- Rapports et états financiers
- Couverture des analystes
- Assemblée des actionnaires
- Assemblée extraordinaire des actionnaires en vue d’approuver le remboursement de capital provenant de l’opération de scission avec Archer Exploration Corp.
- Médias et articles
- Dépôts SEDAR+
- Investisseurs américains - PFIC
- Communiqués
- Développement durable
- Nous joindre
- EN
PROJET FÉNELON, QUÉBEC, CANADA
WEBDIFFUSION DE L’EEP
Wallbridge a tenu un webinaire pour discuter des résultats positifs de l'EEP sur Fénelon.
Date et heure : le mardi 27 JUIN 2023 à 10H00 HAE
Regarder maintenant : https://youtu.be/bTQB0SCSL-o
Projet en bref
| Statut: | Stade d'exploration avancé (ressources minérales définies) |
| Emplacement: | Corridor aurifère Détour-Fénelon, environ 80 km à l'est de la mine d'or Detour Lake (Agnico Eagle Mines) |
| Métal: | Or |
| Propriété: | 100% Wallbridge |
| Activités d'exploration en cours: | En 2024, Wallbridge prévoit réaliser environ 5 000 mètres de forages d'exploration en se concentrant sur la vérification de la minéralisation aurifère à proximité du plan de mine de l'EEP, qui présente un potentiel d'amélioration des paramètres économiques globaux du projet. Près de 20 000 mètres de forages d'exploration réalisés en 2023 et environ 115 000 mètres de forages réalisés en 2022. |
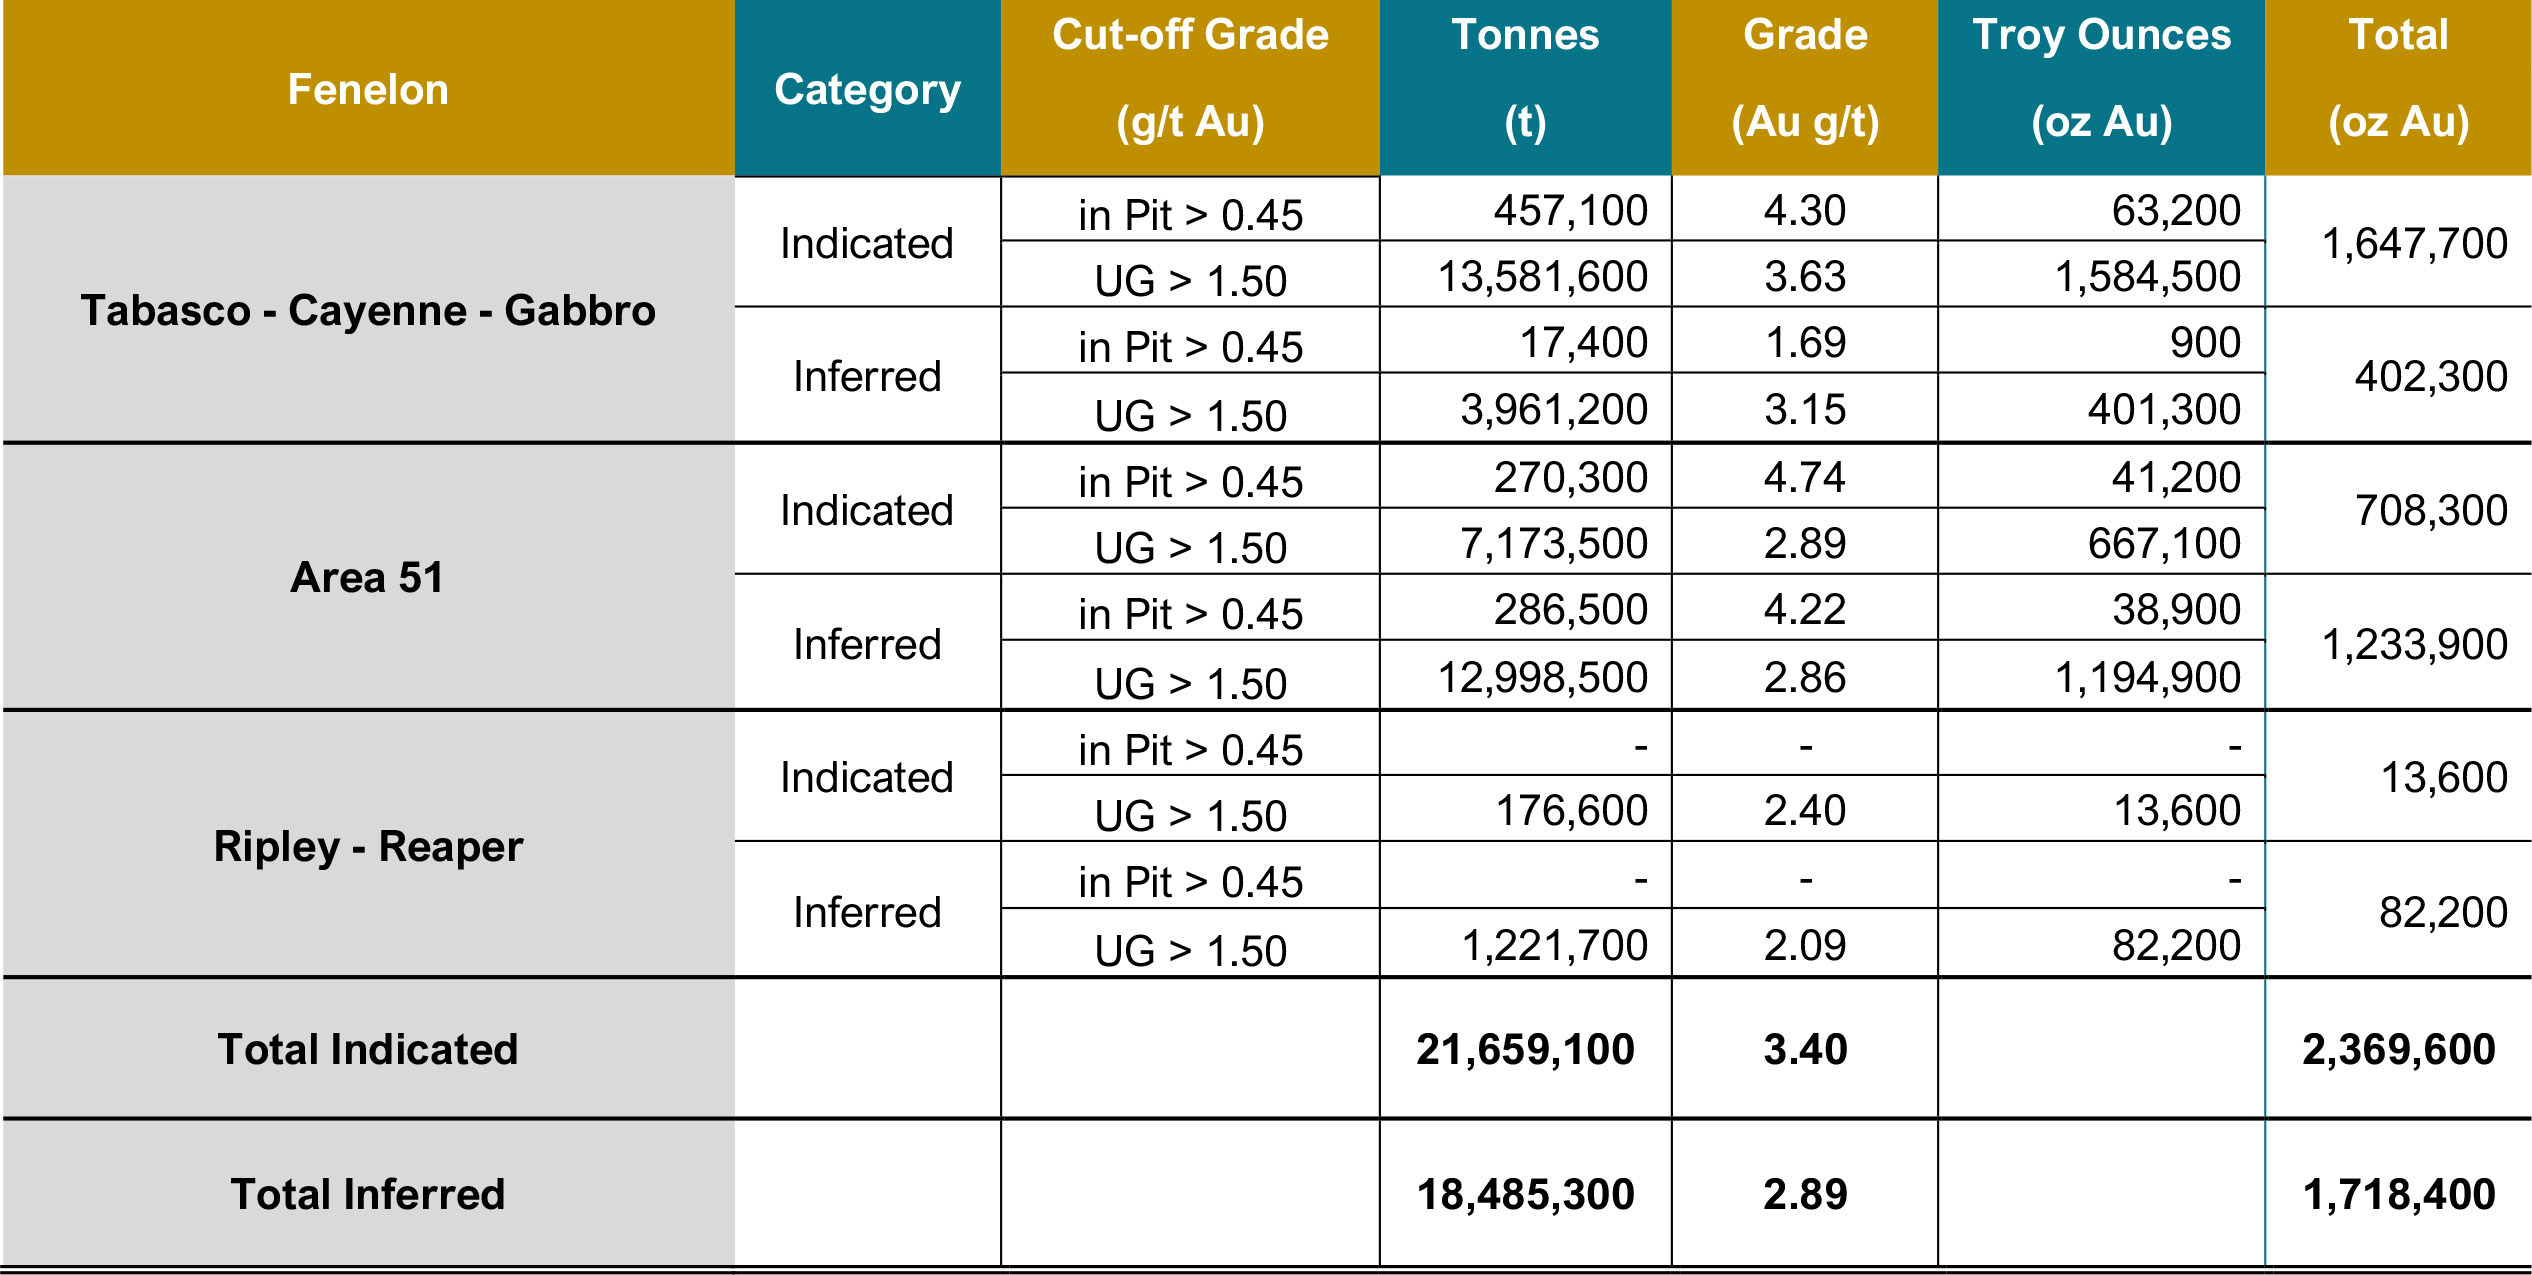
| Ressources minérales: | 2,37 millions d'onces d'or de ressources minérales indiquées et 1,72 million d'onces d'or de ressources minérales présumées. |
En 2024, Wallbridge prévoit réaliser environ 5 000 mètres de forages d'exploration en se concentrant sur la vérification de la minéralisation aurifère à proximité du plan de mine de l'EEP, qui présente un potentiel d'amélioration des paramètres économiques globaux du projet.
Près de 20 000 mètres de forages d'exploration réalisés en 2023 et environ 115 000 mètres de forages réalisés en 2022.
- Aperçu
Fénelon est situé dans la région administrative du Nord-du-Québec, à environ 75 km à l'ouest-nord-ouest de la ville de Matagami, dans la province de Québec, au Canada. En mai 2020, Wallbridge a acquis de Balmoral une importante propriété adjacente à Fénelon. Wallbridge détient une participation indivise de 100 % dans les propriétés adjacentes acquises.
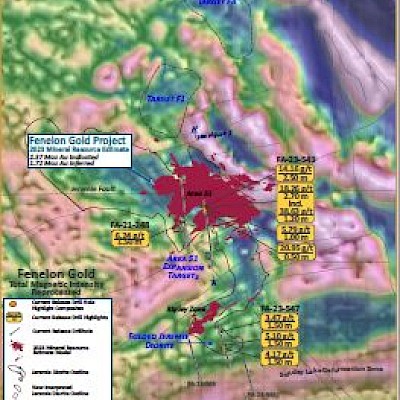
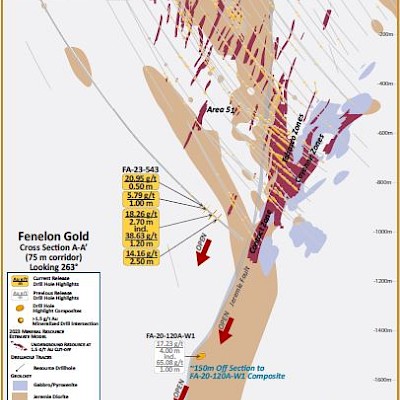
Depuis l'acquisition de la propriété originale de Fénelon en 2016, Wallbridge a réalisé plus de 450 000 m de forages en surface et souterrains et d'échantillonnage en vrac souterrain à Fénelon en date du 31 décembre 2023. Les programmes de forage ont permis d'étendre avec succès l'empreinte du système minéralisé de Fénelon sur la longueur et en profondeur, y compris les nouvelles découvertes dans les zones Area 51 et Lower Tabasco-Cayenne.
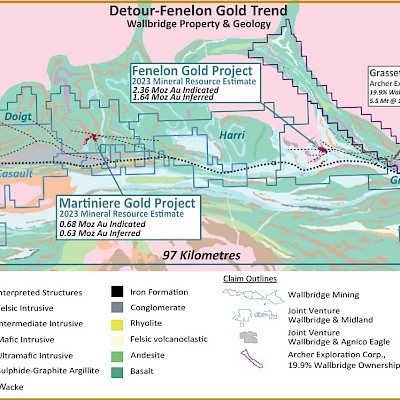
L'ERM 2023 de Fénelon comprend 2,37 millions d'onces de ressources aurifères indiquées et 1,72 million d'onces de ressources aurifères présumées, ce qui représente une augmentation significative de la teneur en or et une augmentation modeste du nombre d'onces contenues par rapport à l'ERM 2021.
Le 26 juin 2023, la Société a annoncé les résultats positifs de l'étude économique préliminaire (« EEP ») réalisée sur Fénelon. L'ERM 2023 a servi de base à l'EEP qui a évalué le potentiel d'une exploitation minière en vrac principalement souterraine à Fénelon. La Société tient à mettre en garde contre le fait que les résultats de l'EEP sont de nature prospective et préliminaire et qu'ils comprennent des ressources minérales présumées qui sont considérées comme trop spéculatives sur le plan géologique pour que des considérations économiques leur soient appliquées et qu'elles puissent être classées comme réserves minérales. Il n'y a aucune certitude que les résultats de l'EEP se concrétiseront. L'analyse économique et financière de l'EEP est fortement influencée par le prix de l'or. Le résumé suivant comprend certaines mesures financières non conformes aux IFRS, telles que le flux de trésorerie disponible, les dépenses initiales en immobilisations, les dépenses en immobilisations de maintien, les coûts décaissés totaux et les coûts de maintien tous compris, qui ne sont pas des mesures reconnues par les IFRS et qui n'ont pas de signification normalisée prescrite par les IFRS. La divulgation de ces mesures financières non conformes aux IFRS est requise par le Règlement 43-101 sur l'information concernant les projets miniers (« Règlement 43-101 ») et a été préparée conformément au Règlement 43-101. Bien que des réconciliations avec des mesures historiques équivalentes ne soient pas disponibles. Veuillez vous référer à la mise en garde et aux mesures financières non conformes aux IFRS à la fin de ce rapport de gestion (pages 24 et 25) pour des définitions et des descriptions détaillées de ces mesures.
Résumé de l'EEP : production annuelle moyenne d'or de 212 000 onces sur 12 ans, avec une production maximale de 240 000 onces. Flux de trésorerie disponibles annuels moyens de 157 M$ sur la durée de vie de la mine, avec des impôts totaux payables au prix de l'or de référence de 792 M$. Valeur actualisée nette (« VAN ») après impôts de 721 M$ au prix de l'or de référence de 1 750 $US et au taux de change $CA/$US de 1,30 $, en utilisant un taux d'actualisation de 5 % et un taux de rendement interne (« TRI ») après impôts de 18 %. VAN après impôts de 1 070 M$ au prix de l'or au comptant de 1 950 $US et d'un taux de change $CA/$US de 1.34 $ et un TRI après impôts de 24 % avec une période de récupération de 4,20 ans à partir du début de la production. Dépenses initiales en immobilisations de 645 M$ incluant une contingence de 54 M$. Dépenses en immobilisations de maintien de 594 M$ incluant une contingence de 44 M$. Coûts décaissés totaux de 749 $US/once incluant les redevances de 4 %. Coûts de maintien tout compris de 924 $US/once. Pour plus de détails sur les résultats de l'EEP à Fénelon, se référer au communiqué de presse du 26 juin 2023 disponible au www.wallbridgemining.com. Le rapport technique conforme au Règlement 43-101 a été déposé sur www.sedarplus.ca et sur le site web de la Société le 10 août 2023. L'EEP résumée ci-dessus n'est destinée qu'à fournir un examen initial de haut niveau du potentiel du projet et des options de conception. Le plan de mine et le modèle économique de l'EEP comprennent de nombreuses hypothèses et l'utilisation de ressources minérales présumées. Les ressources minérales présumées sont considérées comme trop spéculatives pour être utilisées dans une analyse économique, sauf dans les cas autorisés par le Règlement 43-101 dans les études d'EEP. Il n'y a aucune garantie que les ressources minérales présumées puissent être converties en ressources minérales indiquées ou mesurées et, par conséquent, il n'y a aucune garantie que les paramètres économiques du projet décrits dans le présent document seront atteints.
- Programme en cours
Les 5 000 mètres de forage prévus pour Fénelon en 2024 sont principalement destinés à tester la minéralisation aurifère à proximité du plan de mine de l'EEP, qui présente un potentiel d'amélioration des paramètres économiques globaux du projet.
Plusieurs études techniques sont également prévues en 2024 à Fénelon dans le but d'améliorer davantage les paramètres économiques du projet.
- Bref historique
La minéralisation aurifère de la propriété Fénelon a été intersectée pour la première fois par Cyprus Canada en 1988. La zone Discovery (maintenant appelée zones Main Gabbro) a été découverte en 1994. En 1997, Cyprus et Fairstar ont rapporté une ressource (non catégorisée) de 252 000 tonnes à 14,2 g/t Au pour un total de 115 000 onces d'or1. En 1998, Taurus Resources a acquis la participation de Cyprus dans la coentreprise. Entre 1998 et 2004, les activités d'exploration avancée suivantes ont été menées sur la zone Discovery :
- Forage exploratoire (>300 trous de forage)
- Échantillonnage en vrac à ciel ouvert (2001) : 13 835 tonnes ont produit 4 245 onces d’or à une teneur réconciliée de 9,84 g/t Au et un taux de récupération de 97 % (traitement à l’usine Camflo)
- Test initial d’extraction souterraine avec l’échantillonnage en vrac (2003-2004) : 8 169 tonnes produisant 2 596 onces d’or à une teneur réconciliée de 10,7 g/t Au (traitement à l’usine Camflo)
En 2004, l'opérateur de l'époque, International Taurus Resources Inc., était au bord de la faillite alors qu'il préparait la propriété pour une production souterraine. La société a accepté de fusionner avec American Bonanza Gold Mining Corporation (« American Bonanza ») pour créer une nouvelle société et a également acquis la participation de Fairstar dans la propriété Fénelon.
En 2005, un rapport technique conforme au Règlement 43-101 faisait état de ressources mesurées et indiquées après épuisement de 47 927 tonnes à une teneur de 19,61 g/t Au (30 216 onces) et de ressources présumées de 27 245 tonnes à une teneur de 12,79 g/t Au (11 203 onces)1. Des forages supplémentaires ont été réalisés par American Bonanza de 2005 à 2008 (environ 65 trous de forage) ciblant les extensions de la zone Discovery et d'autres cibles sur la propriété.
Vers la fin de 2010, Balmoral Resources Ltd. (« Balmoral ») a acquis la propriété Fenelon d'American Bonanza. En 2011, Balmoral a foré 41 trous de forage pour tester les extensions latérales et en profondeur de la zone Discovery ainsi que ses extrémités est et nord. Le programme de forage a permis de prolonger certaines veines minéralisées de la zone latéralement et jusqu'à une profondeur verticale de 250 mètres.
En octobre 2016, Wallbridge a complété l'acquisition de la propriété Fénelon de Balmoral pour un prix d'achat de 3,7 M$ et a ensuite annoncé en mars 2020 l'acquisition de toutes les actions émises et en circulation de Balmoral dans le cadre d'une transaction équivalente à 110 M$, selon la valeur de négociation des actions de Wallbridge sur 28 jours au 28 février 2020.
- Ces ressources sont historiques de nature et ne peuvent pas être considérées comme fiables. Il est peu probable qu’elles soient conformes aux exigences actuelles du Règlement 43-101 ou qu'elles suivent les normes de définition de l’ICM, et elles n’ont pas été vérifiées pour déterminer leur pertinence ou leur fiabilité. Elles sont comprises dans cette section à titre d’exemple uniquement et ne devraient pas être citées hors contexte.
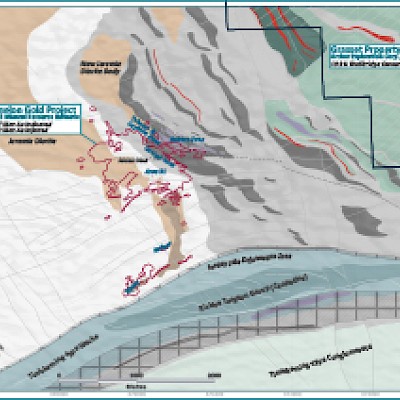
- Géologie et minéralisation
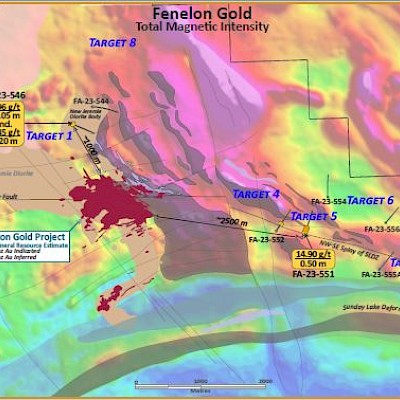
Le projet Fénelon est situé dans le nord-ouest de la sous-province archéenne de l'Abitibi, dans la partie la plus au nord de la ceinture volcano-sédimentaire. Il est situé à moins d'un kilomètre au nord de la zone de déformation Sunday Lake (« SLDZ ») et repose principalement sur un bassin sédimentaire turbiditique et la bordure est du pluton Jérémie.
Les zones de minéralisation aurifère définies jusqu’à présent sont contrôlées et affectées par de la déformation ductile. La minéralisation partage des similitudes avec des gîtes aurifères orogéniques en termes d’associations métalliques, des assemblages d’altération de la roche-mère et des contrôles structuraux. Des éventails secondaires de la SLDZ ont contrôlé l’emplacement d’un système aurifère important à l’intérieur et en bordure du pluton Jérémie. Historiquement, l’exploration s’est concentrée sur les zones de cisaillement à haute teneur situées dans la région du Main Gabbro (emplacement de la mine à ciel ouvert et des galeries souterraines).
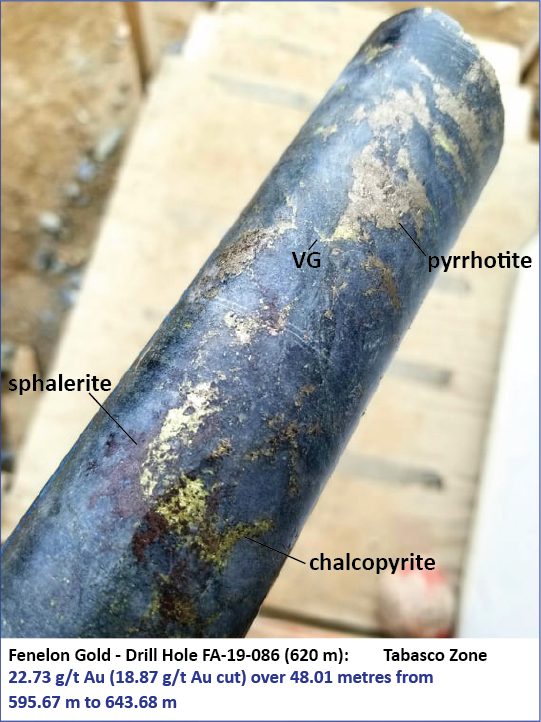
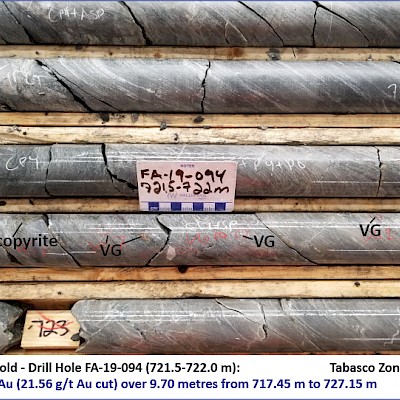
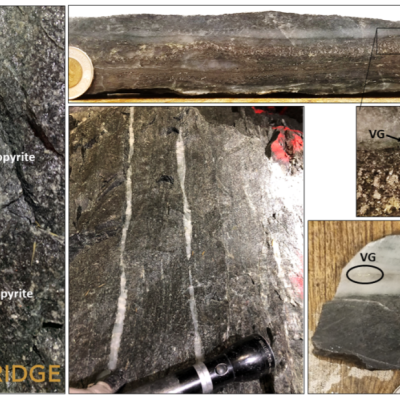
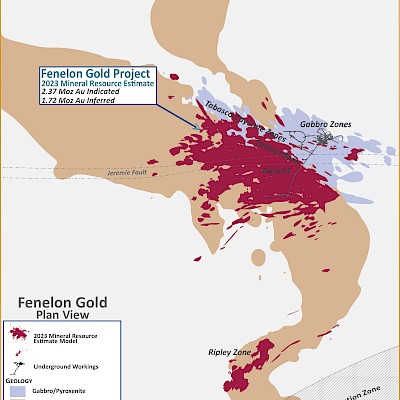
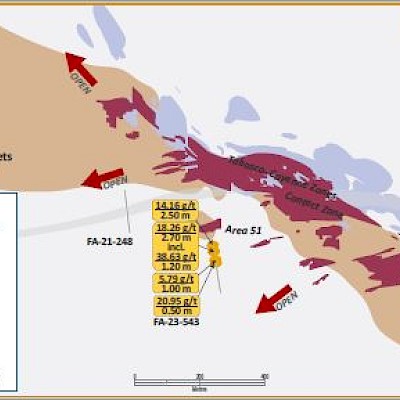
Il y a trois domaines de minéralisation aurifère sur la propriété : les zones Main Gabbro, et les zones Tabasco et Cayenne récemment découvertes, ainsi que la zone Area 51. L’or est associé à de la pyrrhotite, de la chalcopyrite et de la pyrite disséminées, ainsi qu’à de la sphalérite, de l’arsénopyrite et de la marcassite mineures. L’or visible natif est fréquent dans toutes ces zones.
Les zones Main Gabbro contient sept zones : les zones Fresno, Chipotle, Anaheim, Naga Viper, Paprika, Habanero et Serrano. Ces zones minéralisées sont comprises dans un large corridor de gabbro intensément altéré entre deux pans de sédiments argileux.
Les systèmes minéralisés Tabasco et de Cayenne sont présents dans des sédiments turbiditiques entre le Main Gabbro et le pluton Jérémie. Les zones sont orientées nord-ouest/sud-est (130o) et sont inclinées fortement vers le sud. Elles forment un système de cisaillement anastomosé avec plusieurs éventails secondaires. La minéralisation est discrète avec une faible teneur en sulfures (<5 %) et est principalement associée à la silicification et la séricitisation. Les intervalles aurifères sont associés avec un assemblage de pyrrhotite-chalcopyrite. L'arsénopyrite et la sphalérite sont localement présentes. Les meilleurs intervalles aurifères associés aux veines se trouvent dans des intersections avec des veines de quartz gris clair. Les intervalles à haute teneur aurifère de plus de 10 g/t sur 0,5 à 1 m sont fréquents.
La zone Area 51 est contenue dans le pluton Jérémie et son contact. Elle se présente comme une série de sous-zones minéralisées parallèles regroupées en deux couloirs orientés ENE-OSO (Andromeda et Orion) parallèles à la SLDZ. La minéralisation aurifère est principalement associée à des veines de quartz gris translucides qui ont généralement moins de 2-3 cm d’épaisseur et qui sont isolées ou espacées de manière régulière et subparallèle.
Cartes et images (cliquez pour agrandir)
- Estimation des ressources minérales
Fénelon (date effective : 13 janvier 2023)
Notes sur l'ERM du projet Fénelon (13 janvier 2023) :
- Les personnes indépendantes et qualifiées pour la présente ERM 2023 du Corridor aurifère Détour-Fénelon sont Carl Pelletier, P.Geo., Vincent Nadeau-Benoit, P.Geo., Simon Boudreau, P.Eng. et Marc R. Beauvais, P.Eng. d'InnovExplo Inc. L'ERM 2023 du Corridor aurifère Détour-Fénelon est conforme aux normes de définition 2014 de l'ICM et aux lignes directrices 2019 de l'ICM sur les pratiques exemplaires en matière de gestion des ressources minérales. La date effective de l'ERM 2023 du Corridor aurifère Détour-Fénelon est le 13 janvier 2023.
- Ces ressources minérales ne sont pas des réserves minérales, car leur viabilité économique n'a pas été démontrée.
- Les personnes qualifiées n'ont connaissance d'aucun problème connu lié à l'environnement, aux permis, aux lois, aux titres de propriété, à la fiscalité, à la situation sociopolitique ou à la commercialisation, ni d'aucun autre problème pertinent qui pourrait avoir une incidence importante sur la mise en valeur potentielle des ressources minérales autres que celles dont il est question dans l'ERM 2023 du Corridor aurifère Détour-Fénelon.
- Pour Fénelon, 112 zones à haute teneur et sept (7) enveloppes à basse teneur ont été modélisées en 3D sur l'épaisseur vraie de la minéralisation. En s'appuyant sur des mesures, une densité de 2,80 g/cm3 a été appliquée aux blocs situés à l'intérieur des zones à haute teneur et une densité de 2,81 g/cm3 a été appliquée aux blocs situés à l'intérieur des enveloppes à basse teneur. Le plafonnement à haute teneur a été effectué sur les données d'analyse brutes et établi par zone, avec des valeurs comprises entre 25 g/t et 100 g/t Au pour les zones à haute teneur (à l'exception des zones à haute teneur Chipotle et Cayenne 3, pour lesquelles des valeurs de plafonnement à haute teneur de 330 g/t Au ont été appliquées) et des valeurs comprises entre 4 g/t et 10 g/t Au pour les enveloppes à basse teneur. Des composites (1,0 m) ont été calculés à l'intérieur des zones et des enveloppes en utilisant la teneur du matériau adjacent lorsqu'il a été analysé ou une valeur de zéro lorsqu'il n'a pas été analysé. Une largeur minière minimale de 2 mètres a été utilisée pour l'optimisation des chantiers souterrains.
- Pour Martinière, 75 zones à haute teneur et neuf (9) enveloppes à basse teneur ont été modélisées en 3D sur l'épaisseur vraie de la minéralisation. En s'appuyant sur des mesures, une densité de 2,83 g/cm3 a été appliquée aux blocs situés à l'intérieur des zones à haute teneur (à l'exception des zones à haute teneur associées à des intersections de sulfures massifs où une densité de 3,00 g/cm3 a été appliquée), et une densité de 2,81 g/cm3 a été appliquée aux blocs situés à l'intérieur des enveloppes à basse teneur. Le plafonnement des hautes teneurs a été effectué à partir des données brutes d'analyse et établi par zone, avec des valeurs comprises entre 25 g/t et 100 g/t Au pour les zones à haute teneur et entre 1 g/t et 6 g/t Au pour les enveloppes à basse teneur. Des composites (1,0 m) ont été calculés à l'intérieur des zones et des enveloppes en utilisant la teneur du matériau adjacent lorsqu'il a été analysé ou une valeur de zéro lorsqu'il n'a pas été analysé. Une largeur minière minimale de 2 mètres a été utilisée pour l'optimisation des chantiers souterrains.
- Le critère des perspectives raisonnables d'une éventuelle extraction économique a été respecté en appliquant des volumes contraignants à tous les blocs (scénario d'extraction potentielle en surface et souterraine) à l'aide des méthodes Whittle et DSO et en appliquant des teneurs de coupure. La teneur de coupure pour le gisement Fénelon a été calculée en utilisant un prix de l'or de 1 600 $US l'once, un taux de change CA/US de 1,30, un coût d'affinage de 5,00 $/t, un coût de traitement de 18,15 $/t, un coût d'extraction de 5,50 $/t (roche-mère) ou de 2,15 $/t (morts-terrains) pour la partie en surface, un coût d'extraction de 65,00 $/t pour la partie souterraine et des frais généraux et administratifs de 9,20 $/t. Des valeurs de récupération métallurgique de 95,0 % et de redevance de 4,0 % ont été appliquées lors du calcul de la teneur de coupure. La teneur de coupure pour le gisement Martinière a été calculée en utilisant un prix de l'or de 1 600 $US l'once, un taux de change CA/US de 1,30, un coût d'affinage de 5,00 $/t, un coût de traitement de 18,15 $/t, un coût d'extraction de 4,55 $/t (roche-mère) ou de 2,15 $/t (morts-terrains) pour la partie en surface, un coût d'extraction de 118,80 $/t pour la partie souterraine en utilisant la méthode d'extraction par longs trous (LT), un coût d'extraction de 130,70 $/t pour la partie souterraine en utilisant la méthode d'extraction par déblais et remblais (D-R), des frais généraux et administratifs de 9,20 $/t et un coût de transport jusqu’à l’usine de traitement de 6,50 $/t. Des valeurs de récupération métallurgique de 96,0 % et de redevance de 2,0 % ont été appliquées lors du calcul de la teneur de coupure. Les teneurs de coupure devraient être réévaluées à la lumière des conditions futures du marché (prix des métaux, taux de change, coûts d'extraction, etc.).
- Les résultats sont présentés in situ. Once (troy) = tonnes métriques x teneur/31,10348. Le nombre de tonnes et d'onces a été arrondi au millier le plus près. Tout écart dans les totaux est dû à des effets d'arrondissement; l'arrondissement a été effectué conformément aux recommandations du Règlement 43-101.
- Cartes et sections
- Rapport technique
- Estimation des ressources minérales

Abonnez-vous pour recevoir des nouvelles
Notre
gouvernance
Sign Up for Our Mailing List
By entering your information, you consent to receive emails from Wallbridge Mining and agree to our Privacy Policy.
Join Our Team
Wallbridge Mining Company Limited is an equal opportunity employer.
Job offers at Wallbridge Mining
| Titre du poste | Statut | Lieu |
|---|---|---|
| Géologue Sénior | Horaire 14-14 | Fenelon |